
Top 5 Charts of the Week: USA & China Macroeconomic Trends
- Callum Thomas
- Feb 18, 2019
- 3 min read
Here's some of the standout economic and markets charts on my radar (originally posted on LinkedIn). I aim to pick a good mix of charts covering key global macro trends, and ones which highlight risks and opportunities across asset classes.
Hope you enjoy!
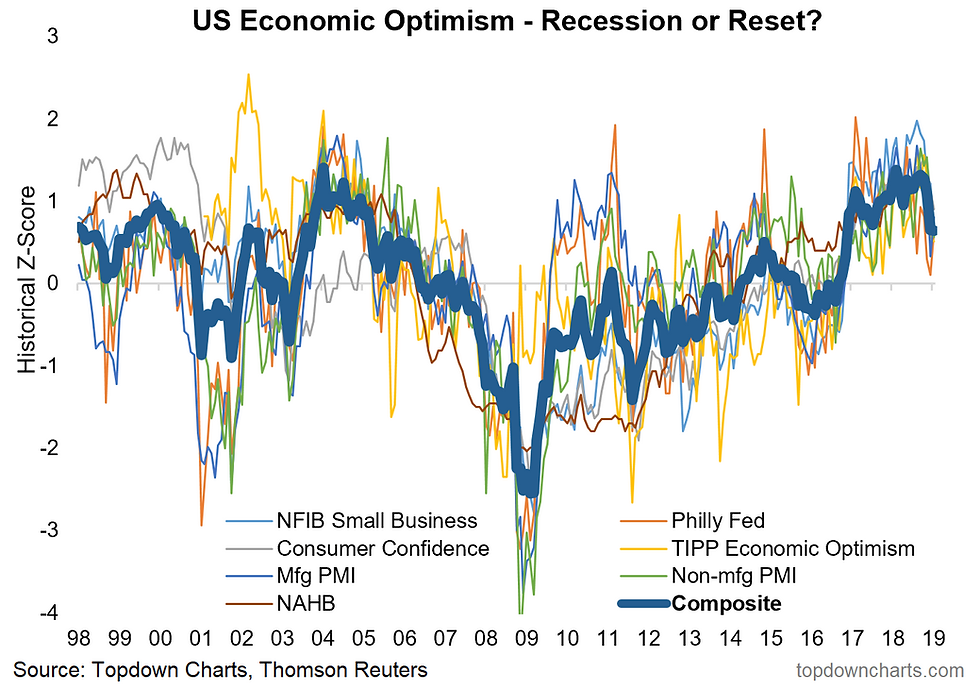
1. US Economic Optimism: Here's an interesting chart - it shows the overall trend in economic confidence in America based off more than half a dozen surveys.
The key point is there has been quite the slump in the last couple of months. I labeled the title "recession or reset?" as a nod to the fact that there seems to be a lot of pundits rushing to call a recession. I think this is premature.
The last couple of months have brought a heavy flow of negative headlines (e.g. the shutdown, tradewar, potential actual wars) and there has been heightened market volatility.
I think this is a reset...
2. US Jobs Market Monitor: A fitting flow-on, this chart (updated with data released this week) shows two angles on the booming US jobs market.
Basically based on the small business survey: small businesses are having trouble finding workers, and based on the consumer confidence survey: consumers are saying it's easy to find a job.
Sure these are late-cycle signals, but it just goes to show how tight the jobs market is right now.

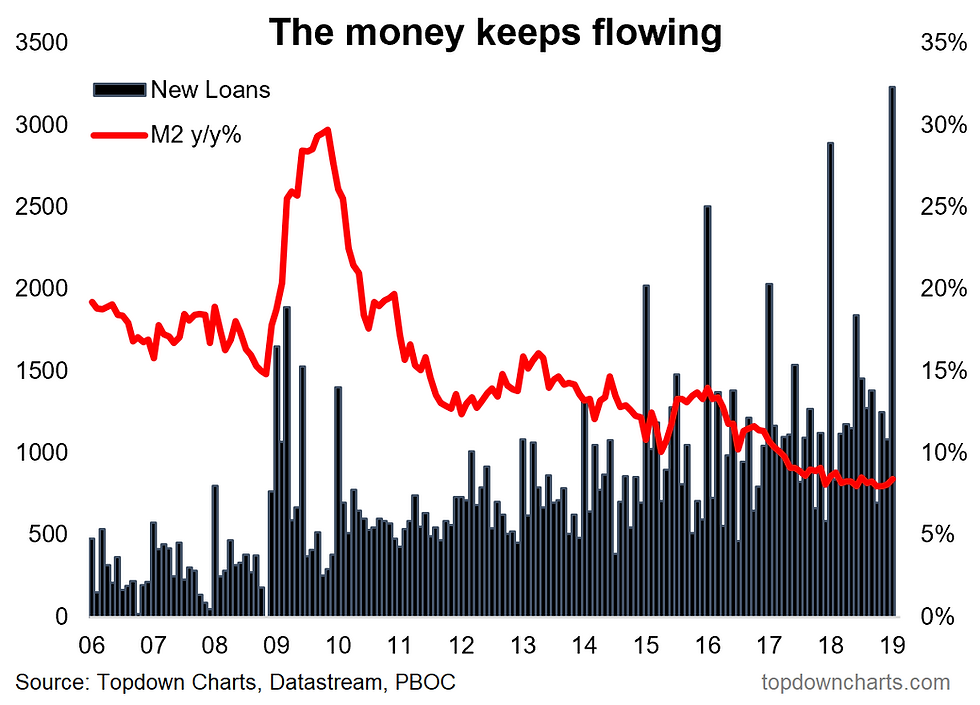
3. China Loan Growth: China is an economy that has a habit of setting records, and yesterday it released some data which set a new record: new loans tracked at a whopping 3 Trillion yuan in January.
It's typical to see loan growth spike in January as loan quotas get reset, but I do expect to see the authorities turning to tried and tested stimulus measures to prop up the economy as the macro pulse has softened there, particularly in the last few months.
Depending on the size and scope of a potential stimulus package out of China this could be an important upside catalyst for global risk assets....
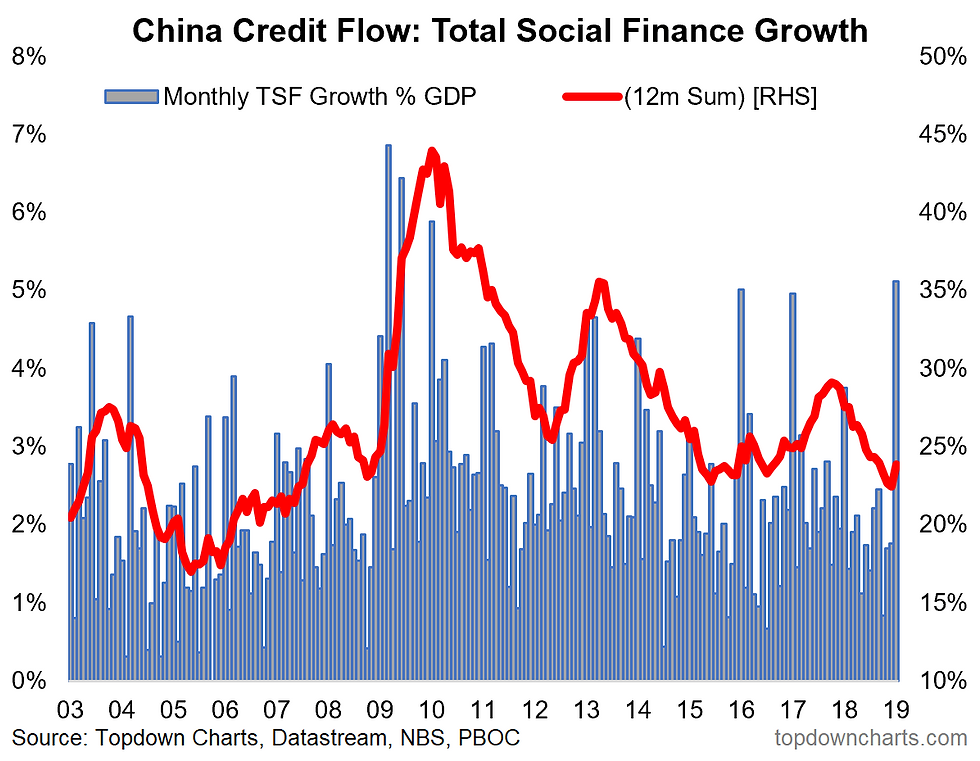
4. China - Normalized TSF Growth: Not to labor the point, but I wanted to also include this chart as it shows the monthly growth in TSF (Total Social Finance - which is a more expansive measure of credit growth), normalized against nominal GDP.
In this view you can see that the January surge is indeed material, but certainly nothing too out of line vs previous years' Januaries.... key will be to see what happens in the February and March credit growth numbers, to get the real picture.
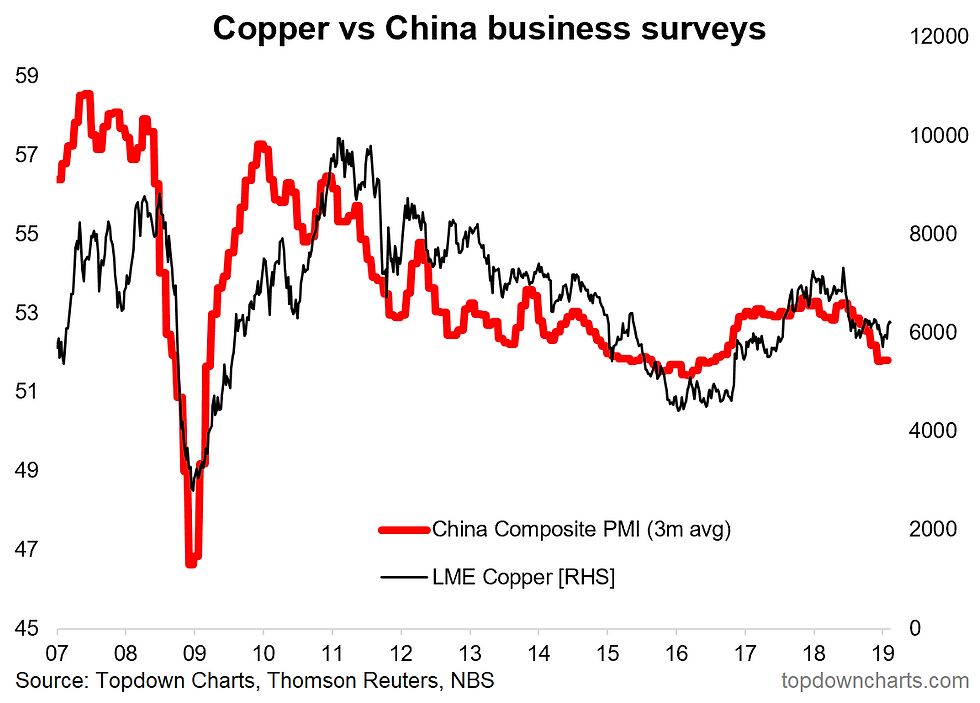
5. China Macro Pulse vs Copper Price: The final chart featured in "Our Best Charts and Calls of 2018", it shows the combined China official PMIs, and as is clear there has been a notable slowdown - it is for this reason I expect to see more stimulus.
Yet there is one complicating factor, and that is (for now) property prices have continued to rise - if that changes, that will speed up the process.
But for now, I also direct attention to the copper price, which will react sooner or later (and possibly in advance of) any China stimulus as China remains by far the dominant consumer of copper globally and the marginal buyer and thus setter of prices. So as always, keep an eye on the charts....
Thanks for reading, I appreciate your interest in my work.
This article was originally posted by me on LinkedIn. Be sure to connect with us there too.


Comments