top of page

Search


Chart Of The Week: Global Cyclicals Vs. Defensives
This week it's global cyclicals vs defensives. Last week we talked about the yield curve, which is something a lot of people are talking...
Callum Thomas
Jul 11, 20181 min read
Weekly Macro Themes - 6 July 2018
Here's a brief preview of the topics and charts covered in the latest edition of the Weekly Macro Themes report. To read more and see the...
Topdown Charts
Jul 8, 20182 min read


Chart: S&P500 Capital Expenditure Growth
This chart looks at the growth of capex (Capital Expenditure, aka business investment) by S&P500 companies (excludes commodity capex...
Callum Thomas
Jul 5, 20181 min read


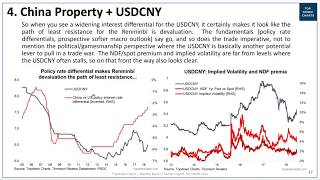
Chart: The Path of Least Resistance for the USDCNY
Today's chart actually comes from a video we released yesterday: "Renminbi Devaluation Risk in Focus". It shows the USDCNY exchange rate...
Callum Thomas
Jul 4, 20181 min read
VIDEO: Renminbi Devaluation Risk in Focus
In this video we look at the USDCNY exchange rate and talk through the top-down view on how the Chinese Yuan could still have a lot...
Topdown Charts
Jul 3, 20181 min read


Chart: US PMI Points to Stronger GDP Growth
The June round of PMI data for the USA brought a conflicting picture month-on-month, but looking at a high-level it confirmed what we had...
Callum Thomas
Jul 3, 20181 min read


Chart: US Credit Managers' Index
This week the attention falls on the popular Purchasing Managers' Indexes (PMI) as just about every country in the world provides a...
Callum Thomas
Jul 2, 20181 min read


Weekly S&P500 #ChartStorm - 1 July 2018
Those that follow my personal account on Twitter will be familiar with my weekly S&P 500 #ChartStorm in which I pick out 10 charts on the...
Callum Thomas
Jul 1, 20187 min read


Chart: Copper and the China PMI
China's June PMI data were just out: the rolling 3 month combined reading (shown in the chart below) was virtually unchanged, and it...
Callum Thomas
Jun 30, 20181 min read
Weekly Macro Themes - 29 June 2018
Here's a brief preview of the topics and charts covered in the latest edition of the Weekly Macro Themes report. To read more and see the...
Topdown Charts
Jun 30, 20182 min read
VIDEO: Top 5 Charts of the Week
In this video we run through the free weekly email newsletter "The Top 5 Charts of the Week" and add a bit of extra comments and context....
Topdown Charts
Jun 28, 20181 min read


Chart: US Jobs Market Perception
There was a striking figure in the latest Conference Board US consumer confidence data - the headlines were all about the decrease on the...
Callum Thomas
Jun 27, 20181 min read


Chart: European Institutional Investor Confidence
The latest Institutional Investor Confidence data from State Street showed a notable drop in the global index, but the standout and...
Callum Thomas
Jun 27, 20181 min read


Chart: Global Equity Market Breadth Breakdown
Here's a key standout chart from the latest Global Cross Asset Market Monitor (one of our weekly chart packs), it shows global equity...
Callum Thomas
Jun 26, 20181 min read


Chart: Global Container Throughput Index
Global trade is one of my favorite variables to track in gauging the state of the global economic cycle. It both reflects changes on the...
Callum Thomas
Jun 26, 20181 min read


Chart: US Stock Market Leverage
With the latest monthly margin debt stats from FINRA just out it's worth taking a look the chart of aggregated stock market leverage. ...
Callum Thomas
Jun 25, 20181 min read


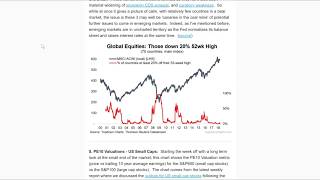
Chart: Small Caps vs Large Caps PE10 Valuations
Starting the week off with a long term look at the small end of the market, this chart shows the PE10 Valuation metric (price vs trailing...
Callum Thomas
Jun 25, 20181 min read


Weekly S&P 500 #ChartStorm - 24 June 2018
Those that follow my personal account on Twitter will be familiar with my weekly S&P 500 #ChartStorm in which I pick out 10 charts on the...
Callum Thomas
Jun 24, 20187 min read


Chart: S&P500 Sector Market Cap Weights
I was doing a bit of work on the US stockmarket in the latest weekly report (specifically on cyclicals vs defensives and small caps), and...
Callum Thomas
Jun 24, 20181 min read


Chart: Flash Manufacturing PMIs and Bond Yields
It's my favorite time of the month... flash PMI time: the June flash manufacturing PMI composite for developed markets fell -1pt to 54.5...
Callum Thomas
Jun 23, 20181 min read
bottom of page