top of page

Search


ChartBrief 177 - The fourth Bond tantrum
US 10-Year Bond Yields have moved through a number of key levels and are on the cusp of a major breakout. Regular readers know by now...
Callum Thomas
Jan 10, 20182 min read


Sentiment Survey: Furious Bulls
The latest weekly sentiment/positioning survey on Twitter revealed a continuation of some very interesting trends and a new record in...
Callum Thomas
Jan 8, 20182 min read


The Charts of 2017 - Honorable Mentions
As part of the release of the 2017 End of Year Special Edition of the Weekly Macro Themes report (a summary of some of the best, worst,...
Callum Thomas
Dec 28, 20172 min read


ChartBrief 170 - Economic Noise and the S&P500
This post looks at a curious and obscure indicator on the US economy which has in the past provided some clues on the outlook for the US...
Callum Thomas
Dec 7, 20172 min read


Crypto Charting: 5 fascinating charts that put the rise of Bitcoin in perspective
Whether it's a bubble, or viral adoption, or something else, I think most would agree that the rise of Bitcoin and cryptocurrencies in...
Callum Thomas
Dec 6, 20173 min read


What I Learned About the S&P500 from Studying the US IPO Market
The US IPO market shows a familiar ebb and flow to the stock market price cycle. Studying the trends in IPO activity can yield...
Callum Thomas
Dec 5, 20172 min read


ChartBrief 168 - Institutional investors are selling global equities into strength
For the second month in a row the State Street Investor Confidence Index came in below 100 (the index uses State Street's global...
Callum Thomas
Nov 29, 20172 min read


ChartBrief 165 - Global Consumer Sentiment Update
The November readings of the Thomson Reuters/Ipsos Consumer Sentiment indexes revealed a picture of solid consumer confidence at a global...
Callum Thomas
Nov 11, 20171 min read
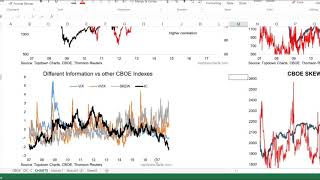
VIDEO: Implied Correlations and the Death of RO-RO
In this video we look at the CBOE Implied Correlation Index and the general evolution of correlations for the S&P500 and what it means...
Topdown Charts
Nov 8, 20171 min read


ChartBrief 163 - Key charts on US Margin Debt
NYSE Margin Debt is an important indicator for US equities as it both reflects sentiment and tracks the amount of leverage and buying...
Callum Thomas
Nov 4, 20172 min read


ChartBrief 162 - Stockmarket Sentiment Surges
Funny things can happen when you mix human psychology with greed and constant stimulus. The seemingly straight-line march upward in the...
Callum Thomas
Oct 27, 20172 min read


ChartBrief 161 - Implied Correlation and SKEW
We hear a lot about the VIX and how volatility is low, but we rarely hear about the VIX's siblings: the CBOE SKEW Index and the CBOE...
Callum Thomas
Oct 18, 20172 min read


Weekly Sentiment Survey: Red Flag
This article reviews the data from the latest weekly sentiment survey we conduct over on Twitter. The survey measures respondents'...
Callum Thomas
Oct 16, 20172 min read


Weekly Sentiment Survey: Bond Bears and Equity Bulls
This article reviews the data from the latest weekly sentiment survey we conduct over on Twitter. The survey measures respondents'...
Callum Thomas
Oct 9, 20172 min read


Weekly Sentiment Survey: Confidence and Complacency
This article reviews the data from the latest weekly sentiment survey we conduct over on Twitter. The survey measures respondents'...
Callum Thomas
Oct 2, 20172 min read
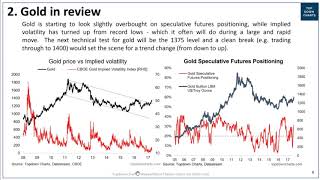
VIDEO: Gold Price Outlook
In this video we look at the short, medium, and long-term outlook for the gold price. Specifically, the video walks through a couple of...
Topdown Charts
Sep 27, 20171 min read


ChartBrief 153 - Sentiment update: Euphoria Heights
The preliminary September reading of The Euphoriameter showed a rebound from August to a fresh new 13-year high. All 3 components...
Callum Thomas
Sep 27, 20172 min read


Weekly Sentiment Survey: Bond Bears
This article reviews the data from the latest weekly sentiment survey we conduct over on Twitter. The survey measures respondents'...
Callum Thomas
Sep 25, 20172 min read


ChartBrief 151 - These 2 incredible ETF AUM charts show what's at stake with QT1
The Fed's plan to normalize its balance sheet will begin to be put in place from next month. This is passive QT or Quantitative...
Callum Thomas
Sep 23, 20172 min read


ChartBrief 149 - A New Extreme in Volatility
The last time I reviewed this chart I pondered the possibility of a turning point or the start of a regime change for volatility... this...
Callum Thomas
Sep 20, 20172 min read
bottom of page