top of page

Search


ChartBrief 177 - The fourth Bond tantrum
US 10-Year Bond Yields have moved through a number of key levels and are on the cusp of a major breakout. Regular readers know by now...
Callum Thomas
Jan 10, 20182 min read


The Charts to Watch in 2018
I spent a lot of time in the 2017 End of Year Special Edition looking back across 2017. I covered some of my best charts and...
Callum Thomas
Jan 2, 20183 min read


2017 People's Choice Charts
Last week we published the 2017 End of Year Special Edition of the Weekly Macro Themes report, a summary of some of the best, worst, and...
Callum Thomas
Dec 27, 20172 min read


ChartBrief 175 - US 10-year Bond Yields about to go to 3.5%?
A couple of things are happening in the bond space right now. Last week we got the flash PMIs for the major DM economies, and all fronts...
Callum Thomas
Dec 20, 20172 min read


Global Equities Have Bad Breadth
Global equities can do little wrong lately, with falling volatility, improving earnings, and an almost straight-line upward march in the...
Callum Thomas
Dec 19, 20172 min read


ChartBrief 172 - When does "so good" become "too good"?
As the global economic cycle heats up, it's worth posing the question: when does "so good" become "too good"? It's a reference to one of...
Callum Thomas
Dec 13, 20172 min read


Expect more volatility?
Globally equity volatility is low. For that matter, volatility (both implied and realized) is low across the major asset classes. But...
Callum Thomas
Dec 12, 20172 min read


ChartBrief 171 - Not Dot Com
I often look at sector composition trends for the S&P500, and one of the areas that is really standing out for me is the Information...
Callum Thomas
Dec 11, 20172 min read


ChartBrief 170 - Economic Noise and the S&P500
This post looks at a curious and obscure indicator on the US economy which has in the past provided some clues on the outlook for the US...
Callum Thomas
Dec 7, 20172 min read
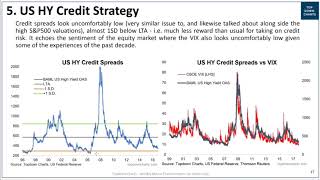
VIDEO: US HY Credit Spreads - a strategic analysis
In this video we look at US HY Credit Spreads and provide a strategic analysis, and comment on how to think about timing this asset class....
Topdown Charts
Nov 29, 20171 min read


ChartBrief 168 - Institutional investors are selling global equities into strength
For the second month in a row the State Street Investor Confidence Index came in below 100 (the index uses State Street's global...
Callum Thomas
Nov 29, 20172 min read


ChartBrief 167 - The Extraordinary Plunge in Stockmarket Volatility
Regular readers and followers on social media will be familiar with this chart, but what will probably be surprising is how this...
Callum Thomas
Nov 27, 20172 min read
VIDEO: Implied Correlations and the Death of RO-RO
In this video we look at the CBOE Implied Correlation Index and the general evolution of correlations for the S&P500 and what it means...
Topdown Charts
Nov 8, 20171 min read


ChartBrief 163 - Key charts on US Margin Debt
NYSE Margin Debt is an important indicator for US equities as it both reflects sentiment and tracks the amount of leverage and buying...
Callum Thomas
Nov 4, 20172 min read


ChartBrief 162 - Stockmarket Sentiment Surges
Funny things can happen when you mix human psychology with greed and constant stimulus. The seemingly straight-line march upward in the...
Callum Thomas
Oct 27, 20172 min read


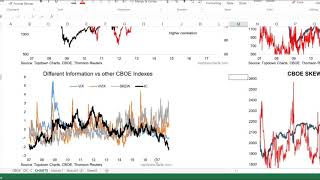
ChartBrief 161 - Implied Correlation and SKEW
We hear a lot about the VIX and how volatility is low, but we rarely hear about the VIX's siblings: the CBOE SKEW Index and the CBOE...
Callum Thomas
Oct 18, 20172 min read


Weekly Sentiment Survey: Red Flag
This article reviews the data from the latest weekly sentiment survey we conduct over on Twitter. The survey measures respondents'...
Callum Thomas
Oct 16, 20172 min read


ChartBrief 158 - Bond Volatility at Rock Bottom
Just like with markets and economies, humans go through cycles of emotion and turning points - it's often the case that when someone hits...
Callum Thomas
Oct 11, 20172 min read


Weekly Sentiment Survey: Bond Bears and Equity Bulls
This article reviews the data from the latest weekly sentiment survey we conduct over on Twitter. The survey measures respondents'...
Callum Thomas
Oct 9, 20172 min read


ChartBrief 155 - TED, HY Credit, VIX
Going through the various charts on credit strategy and risk pricing I noticed a couple of interesting and related charts that I thought...
Callum Thomas
Oct 4, 20172 min read
bottom of page