top of page

Search
Weekly Macro Themes - 22 June 2018
Here's a brief preview of the topics and charts covered in the latest edition of the Weekly Macro Themes report. To read more and see the...
Topdown Charts
Jun 22, 20182 min read


Chart: Seasonality in Credit Spreads
Most people are familiar with the concept of seasonality in the stockmarket, and most of my followers will be familiar with seasonality...
Callum Thomas
Jun 22, 20181 min read


Chart: US Economic Noise Index
Here's a quick update of an obscure and unusual indicator which I call the Economic Noise Index for the USA, shown here against the...
Callum Thomas
Jun 21, 20181 min read
VIDEO: Top 5 Charts of the Week
In this video we run through the free weekly email newsletter "The Top 5 Charts of the Week" and add a bit of extra comments and context....
Topdown Charts
Jun 21, 20181 min read


Chart: Most Shorted Stocks vs the S&P500
This chart draws inspiration from some of the charts and themes I shared in last week's S&P500 #ChartStorm, it shows the Thomson Reuters...
Callum Thomas
Jun 21, 20181 min read


Chart: Global Equity Bear Market Count
This unusual graph shows the proportion of countries' stockmarkets which have entered into a "bear market" - which for the purposes of...
Callum Thomas
Jun 20, 20181 min read


Chart: China Property Price Outlook
This chart comes from the latest Monthly Chartpack, which I just sent out to clients. It shows Chinese property price growth through May...
Callum Thomas
Jun 19, 20181 min read


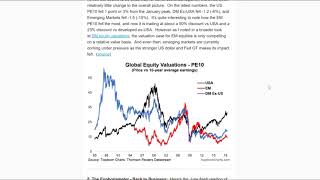
Chart: Global Equity PE10 Valuations
One of our favorite valuation charts for global equities, this one shows the PE10 valuation metric (price divided by rolling 10 year...
Callum Thomas
Jun 19, 20181 min read


Chart: TED Spread and LIBOR-OIS
Here's a timely update on a couple of short-term funding pressure gauges - I noticed the movement in these indicators as I was updating...
Callum Thomas
Jun 18, 20181 min read


Chart: Global Trade - High Frequency Indicators
Kicking off the week, here's a chart of the weekly global trade indicators. This chart shows the z-score for the Baltic Dry Index (bulk...
Callum Thomas
Jun 18, 20181 min read


Weekly S&P 500 #ChartStorm - 17 June 2018
Those that follow my personal account on Twitter will be familiar with my weekly S&P 500 #ChartStorm in which I pick out 10 charts on the...
Callum Thomas
Jun 17, 20186 min read


Chart: Consumers, Manufacturers, and Global Equities
This chart makes use of the Thomson Reuters Ipsos consumer sentiment indexes, which I have aggregated into a GDP weighted global...
Callum Thomas
Jun 16, 20181 min read
Weekly Macro Themes - 15 June 2018
Here's a brief preview of the topics and charts covered in the latest edition of the Weekly Macro Themes report. To read more and see the...
Topdown Charts
Jun 15, 20181 min read


Chart: The Euphoriameter and the S&P500
Here's the June flash reading of the Euphoriameter - which is a composite measure of investor sentiment on the S&P500. The key takeaway...
Callum Thomas
Jun 15, 20181 min read


Chart: China Consumer Confidence vs Retail Sales
Something curious is going on with Chinese retail sales. In contrast to the official consumer confidence index, which has been booming -...
Callum Thomas
Jun 14, 20181 min read


Chart: OECD Leading Indicators - EM vs DM
The latest update to the OECD Composite Leading Indicators (CLI) provides the opportunity to take a look at the weighted average view for...
Callum Thomas
Jun 14, 20181 min read


Chart: China Credit Flows
The May data for China showed a further slowing in the growth of credit. To be clear, total credit is still increasing, but the issue is...
Callum Thomas
Jun 13, 20181 min read
VIDEO: Top 5 Charts of the Week
In this video we run through the free weekly email newsletter "The Top 5 Charts of the Week" and add a bit of extra comments and context....
Topdown Charts
Jun 13, 20181 min read


Chart: US Labor Market Metrics
The US job market is running hot, and that statement is true whether you measure it by the official unemployment rate, or by the consumer...
Callum Thomas
Jun 13, 20181 min read


Chart: Emerging Markets Sovereign CDS
Another update to a really important chart for emerging markets, this one shows the median 5-year sovereign CDS premium across 14...
Callum Thomas
Jun 12, 20181 min read
bottom of page