top of page

Search


ChartBrief 108 - Global bond market breakdown
After the big reflation reset in positioning, global bond markets are showing more signs of breaking down. We previously talked in detail...
Callum Thomas
Jul 15, 20172 min read


ChartCritic 3 - Is this the most irrelevant chart you've ever seen?
Today's edition of ChartCritic takes a look at a chart shared by EconomPic on Twitter (which has also made the rounds of all the usual...
Callum Thomas
Jul 14, 20172 min read
Weekly Macro Themes - 14 July 2017
Here's a brief preview of the topics and charts covered in the latest edition of the Weekly Macro Themes report. To read more and see the...
Topdown Charts
Jul 14, 20172 min read


ChartBrief 107 - China money growth monitor
The June money supply and credit stats out of China confirmed a couple of important trends that we've previously identified. The first...
Callum Thomas
Jul 13, 20171 min read


ChartBrief 106 - Bank of Canada hikes rates
The Bank of Canada has joined the Fed in embarking on the road to monetary policy normalization, hiking the benchmark monetary policy...
Callum Thomas
Jul 13, 20172 min read


ChartBrief 105 - The VIX is at a Seasonal Turning Point
The topic of seasonality is a controversial one among investors. Some swear by it, referring to studies that present evidence for a...
Callum Thomas
Jul 12, 20172 min read
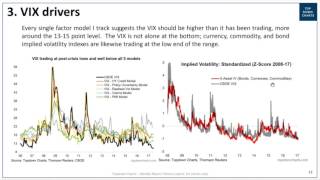
VIDEO: The VIX Drivers and Outlook
In this video we discuss the the drivers of the CBOE Volatility Index (VIX) and assess the outlook and possibility for VIX spikes based...
Topdown Charts
Jul 12, 20171 min read


ChartBrief 104 - Optimism running high on the US economy
The June round of economic confidence surveys on the US economy is basically done and the results show optimism is still running high. I...
Callum Thomas
Jul 12, 20172 min read


ChartBrief 103 - Global Economic Leading Indicators
The latest round of OECD Composite Leading Indicators showed some interesting results country-by-country, but one view we use when...
Callum Thomas
Jul 11, 20171 min read


This FAANG is Not Dot Com
There's been a lot of talk about the so-called FAANG stocks and parallels being drawn against the 2000's dot com bubble. With S&P500...
Callum Thomas
Jul 11, 20171 min read


ChartBrief 102 - China inflation surprises, commodities, and EM
The latest inflation figures out of China weren't much to talk about on the face of it, with CPI at 1.5% yoy in June and PPI at 5.5% -...
Callum Thomas
Jul 11, 20172 min read


ChartBrief 101 - Fundamental sentiment and clues from the bond market
The latest weekly equity (and bonds) sentiment poll I take on Twitter has produced some interesting results this week. I have done this...
Callum Thomas
Jul 10, 20172 min read


ChartBrief 100 - Emerging Markets vs Developed Markets
Well it's ChartBrief number 100 and what better way to mark the milestone with a look at a milestone in the emergence of emerging markets....
Callum Thomas
Jul 10, 20172 min read


ChartBrief 99 - Reflation Futures Positioning Resets
The latest round of COT futures positioning data confirms a very interesting pattern that we have observed over the past year. There has...
Callum Thomas
Jul 9, 20171 min read


ChartBrief 98 - China and Copper Crossroads
A few weeks ago I talked about commodities being at a cross roads, and it's particularly true for this commodity. Copper has been locked...
Callum Thomas
Jul 8, 20172 min read


ChartBrief 97 - Rising Inequality in the S&P500
When you say the words 'rising inequality' it raises all sorts of connotations and thoughts, but in this ChartBrief we look at a peculiar...
Callum Thomas
Jul 7, 20171 min read
Weekly Macro Themes - 7 July 2017
Here's a brief preview of the topics and charts covered in the latest edition of the Weekly Macro Themes report. To read more and see the...
Topdown Charts
Jul 7, 20172 min read
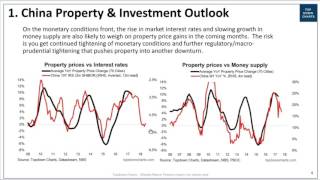
VIDEO: China Property and Investment Outlook
In this video we discuss the outlook for China's property market, real estate fixed asset investment, and the implications for...
Topdown Charts
Jul 6, 20171 min read


ChartBrief 96 - The Euphoriameter Hits a Post-crisis High
The "Euphoriameter" has hit a new post-crisis high in June, indicating increasing levels of euphoria among investors. The indicator...
Callum Thomas
Jul 6, 20171 min read


ChartCritic 2 - The long and short of VIX
Today's edition of ChartCritic takes a look at a chart that was shared by Jesse Felder on Twitter which shows the relative $ value traded...
Callum Thomas
Jul 6, 20172 min read
bottom of page