top of page

Search


ChartBrief 84 - Know this chart, know the Fed
With the FOMC meeting underway at the time of writing, it's worth going through one of my favorite #FedCharts - and it is one that in my...
Callum Thomas
Jun 14, 20172 min read


To understand Bank stocks, watch property prices
In this article we look at how global property price trends influence financial sector stocks, and perhaps more interestingly - what the...
Callum Thomas
Jun 13, 20172 min read
VIDEO: New Zealand property - bubble?
In this video we look at a couple of indicators that show the New Zealand property market as extremely overvalued against history. ...
Topdown Charts
Jun 12, 20171 min read


ChartBrief 83 - An average year for the S&P500
Seasonality is something that matters in markets, economics, and life! Most people have heard of the term "sell in May" (and the rest of...
Callum Thomas
Jun 12, 20172 min read
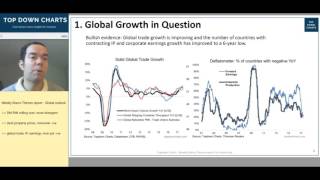
VIDEO: Global growth outlook in question
The global manufacturing PMI has peaked, bond yields have rolled over, and growth looks to be more divergent lately, so the global growth...
Topdown Charts
Jun 7, 20171 min read


The Great Capitulation
A great capitulation is underway in the equity market. And we've seen this type of thing happen only once before. The chart in this...
Callum Thomas
Jun 7, 20172 min read


ChartBrief 82 - Institutional investor confidence indicates capitulation
The May reading of the global State Street Investor Confidence Index rose +5.1 pts to 102.5 which indicates institutional investors are...
Callum Thomas
Jun 2, 20172 min read


ChartBrief 81 - China PMI muddles along in May
China just released it's May official PMI data, and overall the results are fairly benign, and on the surface not much to change the view....
Callum Thomas
May 31, 20171 min read


ChartBrief 80 - Global Trade Growth Trends
Since the global synchronized economic rebound that got underway in the middle of last year, one key standout and something I've been...
Callum Thomas
May 26, 20171 min read


ChartBrief 79 - DM PMI Still Points to Higher Yields
The latest round of flash manufacturing PMIs for May saw the Eurozone in the lead up +0.3 to 57.0 and USA trailing behind, down -0.3 to...
Callum Thomas
May 24, 20172 min read


Asian Equities: Barrier or Breakout?
The MSCI Asia Ex-Japan Index is approaching familiar territory. The 750 level was last reached at the height of the Chinese stock bubble...
Callum Thomas
May 23, 20172 min read
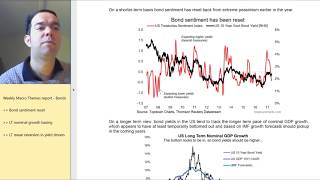
VIDEO: The long and short of US bond yields
In this video we look at a series of charts on US bond yields from the Weekly Macro Themes report. The main chart of interest shows our...
Topdown Charts
May 22, 20171 min read


ChartBrief 78 - Commodities Crossroads
Commodities are at a crossroads (as an asset class, i.e. looking at the broad investable index, in this case the GSCI Light Energy Index)....
Callum Thomas
May 18, 20172 min read


ChartBrief 77 - Keep an eye on the CLIs
The latest round of the OECD Composite Leading Indicators [CLI] showed on the surface a fairly rosy assessment of the global economic...
Callum Thomas
May 17, 20172 min read


Another look at volatility that will leave you scratching your head
In this article I look at an alternative view of volatility, and it's a view that frankly has me scratching my head. The chart appeared...
Callum Thomas
May 16, 20172 min read
VIDEO: US Dollar Index Outlook
In this video we look at a series of charts on the US Dollar Index or DXY from the Weekly Macro Themes report. The main chart of...
Topdown Charts
May 15, 20171 min read


Global Equities: Rising Risk of a Pullback
This article looks at a unique indicator for global equities that captures quite a different kind of market breadth: market valuation...
Callum Thomas
May 13, 20171 min read


A Chart for Gold Bugs and Bashers alike
This week I thought I would focus on a particularly interesting chart for the outlook for the gold price. I think it is particularly...
Callum Thomas
May 2, 20172 min read


ChartBrief 75 - China and the transition from bad to OK
The China official (National Bureau of Statistics) PMI results for April showed a clearly weaker result than March, but with most of the...
Callum Thomas
May 1, 20172 min read


ChartBrief 74 - Commodities have bad breadth
Commodity market breadth measures show a market that looks vulnerable. The below charts apply market breadth measures to the GSCI (Light...
Callum Thomas
Apr 29, 20171 min read
bottom of page