top of page

Search


Weekly S&P500 #ChartStorm - 25 Feb 2018
Those that follow my personal account on Twitter will be familiar with my weekly S&P500 #ChartStorm in which I pick out 10 charts on the...
Callum Thomas
Feb 25, 20186 min read


Implied Correlation Index Flashes a Buy Signal
I've talked about the CBOE implied correlation index a few times before, but it's very timely to revisit this indicator as the February...
Callum Thomas
Feb 20, 20182 min read


Cyclicals vs Defensives - the next shoe to drop?
The February stockmarket correction has investors scrambling to find the reason behind the rapid fall in the major indexes, with various...
Callum Thomas
Feb 14, 20182 min read


ChartBrief 186 - Bear Market Indicator
Don't let the title put you off, this bear market warning indicator is actually giving the all clear. This chart featured in the first...
Callum Thomas
Feb 7, 20181 min read


Sentiment Snapshot: Meltdown?
A few weeks ago I wrote a report outlining the sentiment snapshot for markets, the theme was "melt up" as a number of sentiment...
Callum Thomas
Feb 5, 20184 min read
Weekly Macro Themes - 19 Jan 2018
Here's a brief preview of the topics and charts covered in the latest edition of the Weekly Macro Themes report. To read more and see the...
Topdown Charts
Jan 20, 20182 min read


ChartBrief 180 - On Bulls and Bears
Studying sentiment surveys can help not only in short-term stockmarket timing decisions, but also in understanding the broader mood of...
Callum Thomas
Jan 18, 20182 min read


Something Strange in a Strange Credit Indicator
As I was going through and updating the various indicators that I monitor something in the credit space surprised me. The NACM CMI (think...
Callum Thomas
Jan 16, 20182 min read


Sentiment Snapshot: Did somebody say Melt-Up?
I had to think a bit before going with that title. The term "melt-up" is an increasingly overused word, and given this article features...
Callum Thomas
Jan 15, 20183 min read
Weekly Macro Themes - 12 Jan 2018
Here's a brief preview of the topics and charts covered in the latest edition of the Weekly Macro Themes report. To read more and see the...
Topdown Charts
Jan 12, 20182 min read


ChartBrief 178 - Market Seasonality Maps
Another year another datapoint... Regular readers will be familiar with the first chart which shows the average daily returns for the...
Callum Thomas
Jan 11, 20183 min read


The Charts of 2017 - Honorable Mentions
As part of the release of the 2017 End of Year Special Edition of the Weekly Macro Themes report (a summary of some of the best, worst,...
Callum Thomas
Dec 28, 20172 min read


2017 People's Choice Charts
Last week we published the 2017 End of Year Special Edition of the Weekly Macro Themes report, a summary of some of the best, worst, and...
Callum Thomas
Dec 27, 20172 min read
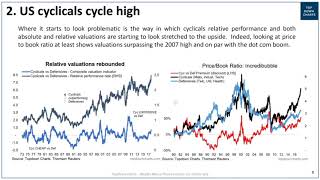
VIDEO: US Cyclicals vs Defensives and the new Bull Market
In this video we look at the astounding relative performance seen between cyclical stocks vs defensive stocks and why it matters so much...
Topdown Charts
Dec 13, 20171 min read


ChartBrief 171 - Not Dot Com
I often look at sector composition trends for the S&P500, and one of the areas that is really standing out for me is the Information...
Callum Thomas
Dec 11, 20172 min read


ChartBrief 170 - Economic Noise and the S&P500
This post looks at a curious and obscure indicator on the US economy which has in the past provided some clues on the outlook for the US...
Callum Thomas
Dec 7, 20172 min read
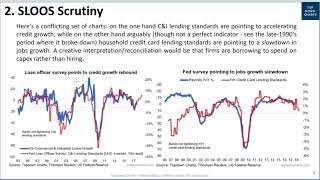
VIDEO: SLOOS Scrutiny - 2 Charts say Boom or Doom for US economy
In this video we look at the US Federal Reserve's senior loan officer survey and how a couple of key indicators in that report spell it...
Topdown Charts
Dec 6, 20171 min read


What I Learned About the S&P500 from Studying the US IPO Market
The US IPO market shows a familiar ebb and flow to the stock market price cycle. Studying the trends in IPO activity can yield...
Callum Thomas
Dec 5, 20172 min read


ChartBrief 169 - December seasonality and the "Santa Claus rally"
The "Santa Claus rally" refers to the tendency for the S&P500 to do well in December, and specifically the last part of December. We can...
Callum Thomas
Dec 3, 20172 min read


ChartBrief 167 - The Extraordinary Plunge in Stockmarket Volatility
Regular readers and followers on social media will be familiar with this chart, but what will probably be surprising is how this...
Callum Thomas
Nov 27, 20172 min read
bottom of page