
Tuesday Technicals - 27 September 2016
- Callum Thomas
- Sep 27, 2016
- 3 min read
Here's the regular quick draw 5 macro technical charts (going as far as individual commodities, currencies, bonds, and sectors, as well as the rest of the major indexes and benchmarks). No comments on anything except the technical/price developments. Even if you're not technical analysis minded it's a useful way to keep on top of trends in some of the main financial markets and as a prompt for further investigation...
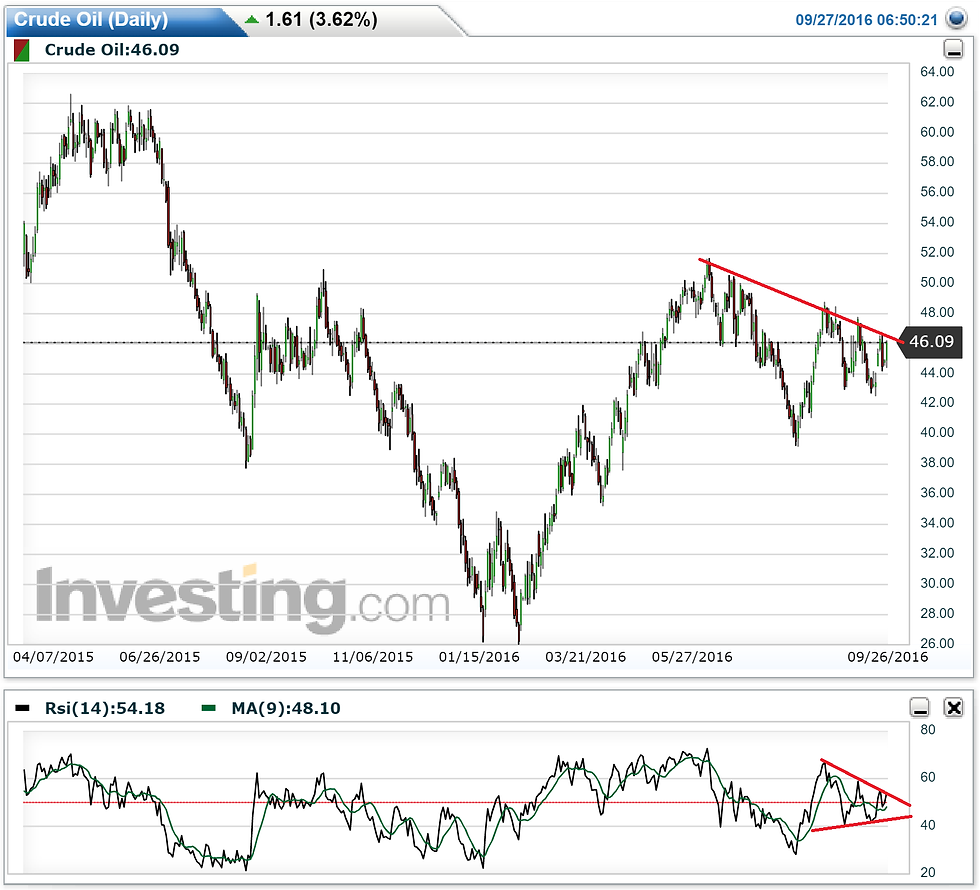
1. Crude Oil - At a critical point
-Downtrend line on the daily chart shows the dominant short term direction in crude oil. After touching this downtrend line the likely next move is down short term.
-RSI also sitting in a symmetrical triangle; coiling up for the next move (by the way, despite this bearish message, watch for any upside break of that downtrend line on price and go with it).
-On sentiment, the Sentix Crude Oil Neutrality Index shows extreme uncertainty... in recent history this sort of pattern has been short term bearish and indicative of a top.
Overall technical view: Bearish short term, but open minded on a break of that red line

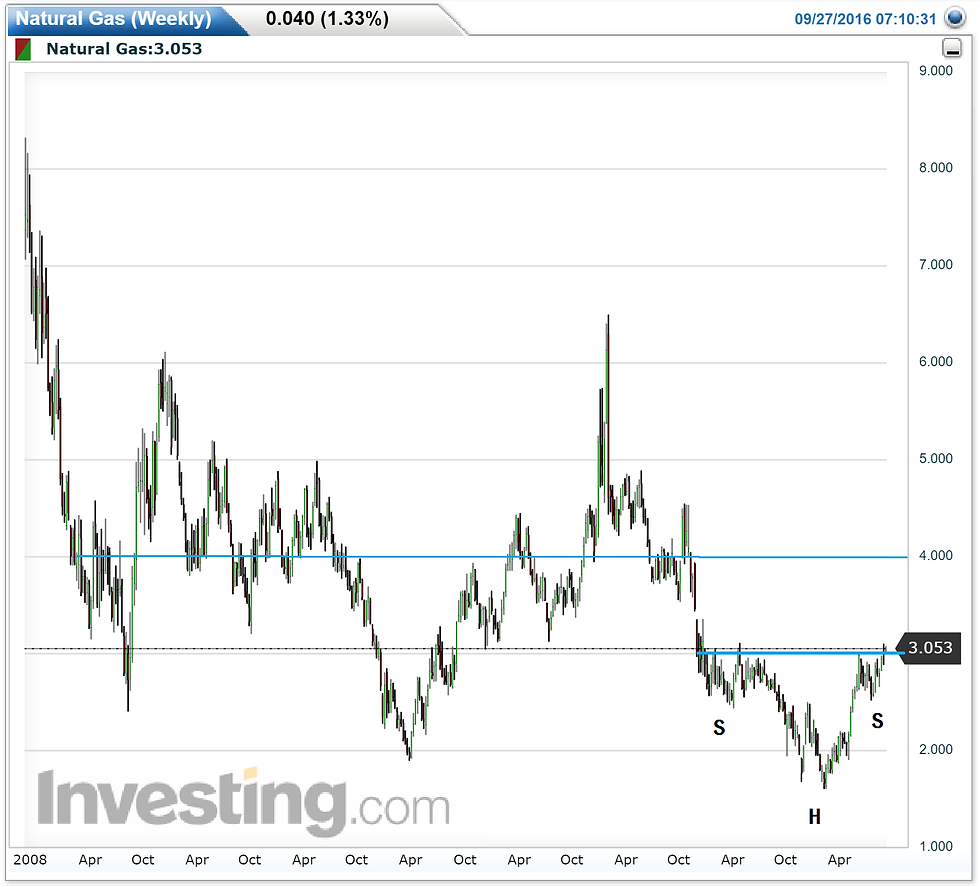
2. Natural Gas - Breakout
-Head and shoulders bottom playing through on the weekly chart, price has just broken through the neckline.
-The $3 mark remains important with the failed 2009 breach to the downside, and 2012 bottom confirmed around the $3 point; in this case it is the neckline for the H&S pattern.
-Medium term price target is $4 (simple head and shoulders measure rule, and that's where resistance is).
Overall technical view: Bullish medium term
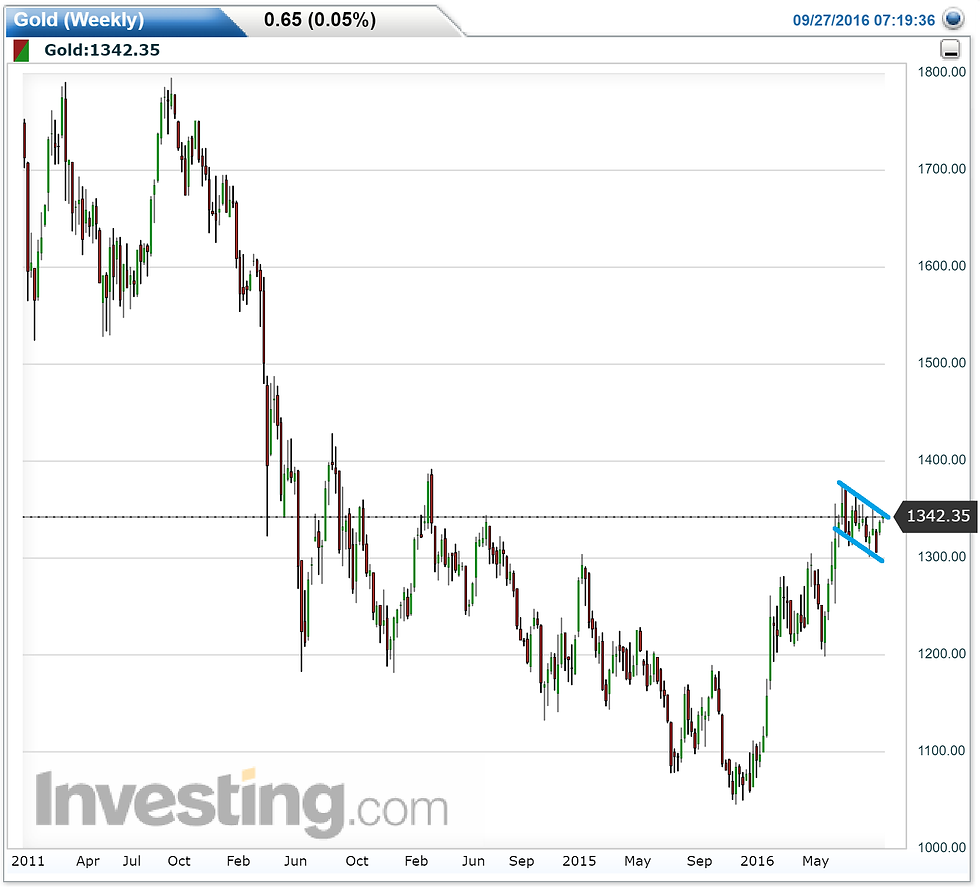
3. Gold - Bull flag
-Bull flag continuing to play out on the weekly chart.
-Typically a continuation pattern, the measure rule says price target for an upside breakout would be above $1400
-Still dependent on an upside breakout; it will not be a "bull flag" unless and until it breaks to the upside, but if it does it will move above $1400 in short order and from that point the gold bull market will become the main narrative.
Overall technical view: Bullish bias, but wait for the breakout
4. US Small Caps - Closing in on resistance
-The Russell 2000 small cap index put in a major inverse head and shoulders pattern through 2015/16, which would suggest a mechanical price target north of 1400.
-It has managed to stay above the 50 day moving average despite a few dips in what has otherwise been a solid stretch of absolute and relative performance.
-On the relative performance (against the S&P500) aspect it seems to be in the process of breaking up through the line in the sand of the past few years which will support its run against resistance of 1275; a break of which will lift conviction.
Overall technical view: Bullish, gain further conviction on a break of 1275

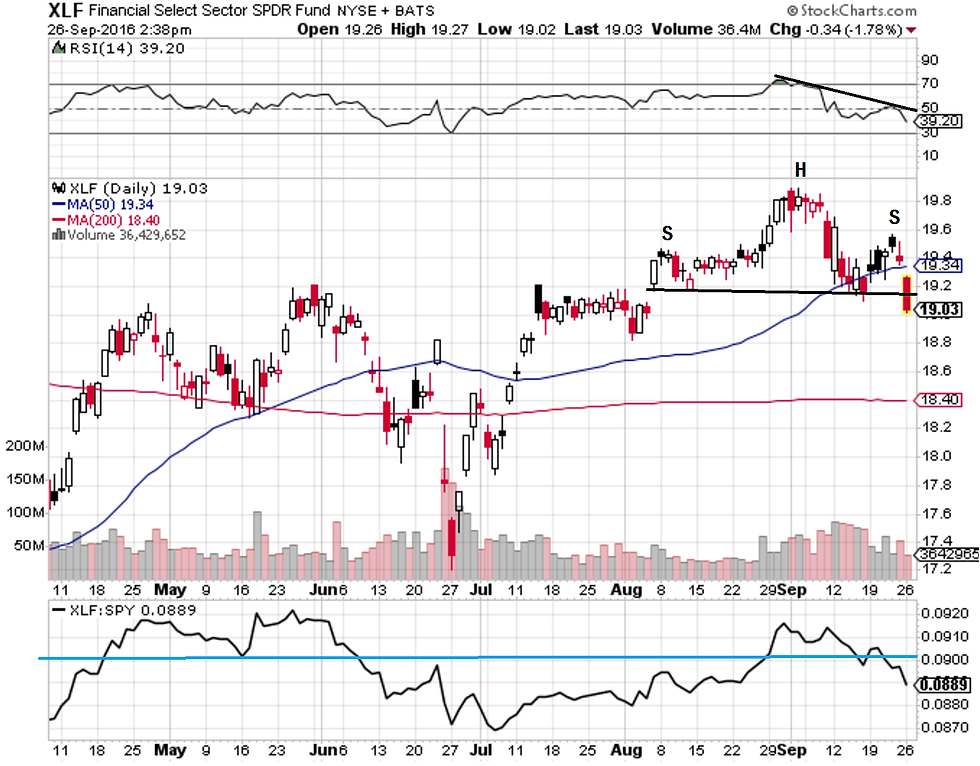
5. Financials - Head and Shoulders Top
-Financials ETF just put in a head and shoulders top with the intraday break of the neckline; price target of H&S is a move back towards the lows of $18
-Second strike is that the gap down today also marks a downside break of the 50 day moving average.
-Third strike is the poor relative performance, with the ratio vs the S&P500 dropping below the point where major weakness erupted in June.
Overall technical view: Bearish short term
Thanks to StockCharts.com and Investing.com for charts.
Previous editions:


Tuesday Technicals - 27 September 2016 may have focused on structured insights and practical takeaways, but interestingly, the same principle of step-by-step understanding applies when we look at pregnancy nutrition. Just as technical analysis breaks down complex data into phases, this connects to how pregnancy is also divided into stages, each with unique nutritional needs. Another factor to consider is that recognizing these changes early can help ensure both maternal health and fetal development are well supported.
To begin with, the first trimester is often the most sensitive phase. Many women experience symptoms during first trimester such as nausea, fatigue, and sudden food aversions. This is where the idea of first trimester diet plan embracing nutritional excellence becomes crucial. Focusing…
Looking back at Tuesday Technicals - 27 September 2016, the focus was on understanding practical, real-world technical elements that quietly support larger systems. These discussions were not just about theory, but about how small design choices, materials, and processes directly influence performance, safety, and reliability in professional environments. Interestingly, this way of thinking still applies today, especially when we examine infrastructure components that are often overlooked but are absolutely critical to controlled spaces.
This connects naturally to modern laboratory design, where every detail matters. Just as earlier technical insights emphasized precision and functionality, today’s research and testing facilities depend heavily on well-engineered physical systems. Another factor to consider is that laboratories are no longer simple rooms with equipment; they are…
After exploring the Tuesday Technicals - 27 September 2016, it becomes clear that discussions around efficiency, smart planning, and practical solutions have always been at the forefront of operational thinking. Interestingly, many of the technical principles highlighted earlier—such as optimizing space, reducing overheads, and improving accessibility—continue to shape modern infrastructure decisions. This naturally connects to how individuals and businesses today are rethinking storage and space management in a more flexible and scalable way.
Another factor to consider is how evolving work environments and project-based operations demand solutions that can adapt quickly. Traditional fixed storage facilities often fall short when timelines are short or locations change frequently. This is where mobile storage units emerge as a practical extension of technical efficiency. They…
Following on from Tuesday Technicals – 27 September 2016, it’s interesting to see how discussions around process discipline and operational clarity have only grown more relevant over time. Back then, the focus was often on improving workflows and minimizing errors through better documentation. This naturally connects to how modern organizations now rely heavily on SOPs to bring structure, repeatability, and confidence into everyday operations.
Interestingly, many of the challenges highlighted earlier—such as inconsistent execution, dependency on individuals, and lack of accountability—are exactly what standard operating procedures are designed to solve. By clearly defining operating procedures, businesses ensure that tasks are performed the same way every time, regardless of who is executing them. This consistency becomes even more critical as teams expand and…
After wrapping up Tuesday Technicals – 27 September 2016, which focused on sharpening practical understanding and analytical thinking, it is interesting to see how those technical foundations connect seamlessly with real-world legal remedies. This transition feels natural because, much like technical problem-solving, litigation strategy also depends on knowing when and how to use the right procedural tools. This connects directly to extraordinary remedies such as SLP / Special Leave Petition and the transfer petition, both of which play a decisive role in the Indian judicial system.
Another factor to consider is that litigation does not always end at the first or second forum. Often, despite exhausting ordinary remedies, parties continue to face injustice or procedural unfairness. This is where the special leave petition becomes…