top of page

Search
VIDEO: New Zealand property - bubble?
In this video we look at a couple of indicators that show the New Zealand property market as extremely overvalued against history. ...
Topdown Charts
Jun 12, 20171 min read
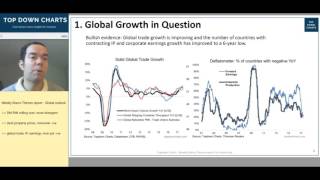
VIDEO: Global growth outlook in question
The global manufacturing PMI has peaked, bond yields have rolled over, and growth looks to be more divergent lately, so the global growth...
Topdown Charts
Jun 7, 20171 min read


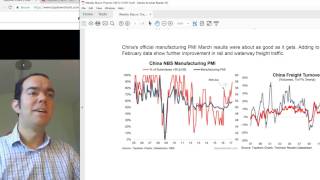
ChartBrief 81 - China PMI muddles along in May
China just released it's May official PMI data, and overall the results are fairly benign, and on the surface not much to change the view....
Callum Thomas
May 31, 20171 min read


ChartBrief 80 - Global Trade Growth Trends
Since the global synchronized economic rebound that got underway in the middle of last year, one key standout and something I've been...
Callum Thomas
May 26, 20171 min read


ChartBrief 79 - DM PMI Still Points to Higher Yields
The latest round of flash manufacturing PMIs for May saw the Eurozone in the lead up +0.3 to 57.0 and USA trailing behind, down -0.3 to...
Callum Thomas
May 24, 20172 min read


ChartBrief 77 - Keep an eye on the CLIs
The latest round of the OECD Composite Leading Indicators [CLI] showed on the surface a fairly rosy assessment of the global economic...
Callum Thomas
May 17, 20172 min read


ChartBrief 76 - Wobbles in global growth
While the manufacturing PMIs are notoriously volatile series month-to-month, they give us the most timely and relatively high frequency...
Callum Thomas
May 3, 20171 min read


A Chart for Gold Bugs and Bashers alike
This week I thought I would focus on a particularly interesting chart for the outlook for the gold price. I think it is particularly...
Callum Thomas
May 2, 20172 min read


ChartBrief 74 - Commodities have bad breadth
Commodity market breadth measures show a market that looks vulnerable. The below charts apply market breadth measures to the GSCI (Light...
Callum Thomas
Apr 29, 20171 min read


ChartBrief 73 - Eurozone vs USA, whose economy is doing better?
As we covered a few days ago, looking just at the manufacturing PMIs it is clear that the Eurozone economy is looking much stronger than...
Callum Thomas
Apr 26, 20171 min read
Weekly Macro Themes - 21 Apr 2017
Here's a brief preview of the topics and charts covered in the latest Weekly Macro Themes report. To read more and see the charts just...
Topdown Charts
Apr 22, 20171 min read


ChartBrief 72 - Global Flash PMI: A Divergence
The global flash manufacturing PMI was basically unchanged in April as improvement in Europe and Japan offset further slowing in the US...
Callum Thomas
Apr 22, 20171 min read


ChartBrief 71 - US Housing Market Outlook
This week we got the NAHB Housing Market Index for April - a key gauge of US housing market health. The index fell slightly to 68 (vs...
Callum Thomas
Apr 20, 20171 min read


ChartBrief 67 - Global trade winds warming up
One thing I’ve been watching closely over the last couple of years is the pace of global trade growth. In the lead up to the market...
Callum Thomas
Apr 4, 20172 min read
VIDEO: China, Cycles, and Copper
In this video we look at some of the latest economic data out of China that shows a strengthening cyclical upturn both on the hard...
Topdown Charts
Apr 3, 20171 min read
Weekly Macro Themes - 31 Mar 2017
Here's a brief preview of the topics and charts covered in the latest Weekly Macro Themes report. To read more and see the charts just...
Topdown Charts
Apr 1, 20171 min read
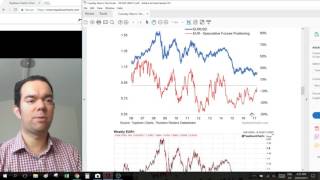
VIDEO: EURUSD - The turning tides
In this video we look at a couple of charts on the EURUSD exchange rate that show something really quite interesting is going on in this...
Topdown Charts
Mar 29, 20171 min read
VIDEO: China Property Prices - must watch charts...
This video looks at some of the must-watch charts on China's property market. Every investor should have the Chinese property market on...
Topdown Charts
Mar 20, 20171 min read


ChartBrief 62 - Commodity warning signs
Every now and then you come across a chart that goes against your bias or your previous assumptions, and often times these charts are...
Callum Thomas
Mar 16, 20172 min read


ChartBrief 59 - The Fed Sweet Spot Indicator
This chart comes from the latest edition of the Weekly Macro Themes in which I talked about why another Federal Reserve rate hike is...
Callum Thomas
Mar 8, 20172 min read
bottom of page