top of page

Search


Sentiment Snapshot: Of Two Minds
The latest weekly survey of investor positioning and views on Twitter showed a slight rebound in overall net bullishness, but as with the...
Callum Thomas
Apr 2, 20183 min read


ChartBrief 200 - Credit Managers' Index
The NACM "Credit Managers' Index" or CMI is the often forgotten indicator which, similar to its cousin the PMI (Purchasing Managers'...
Callum Thomas
Mar 30, 20183 min read
Weekly Macro Themes - 30 Mar 2018
Here's a brief preview of the topics and charts covered in the latest edition of the Weekly Macro Themes report. To read more and see the...
Topdown Charts
Mar 29, 20182 min read


ChartBrief 199 - Institutional Investor Sentiment
The March data for the State Street Investor Confidence was released this week and showed some very interesting patterns across...
Callum Thomas
Mar 29, 20182 min read


Global Equities Bargain Bin (DM Edition)
With the correction in global stock markets still running its course, it's worth surveying some valuation statistics across Developed...
Callum Thomas
Mar 28, 20182 min read


Global Equity Breadth Check: New Lows
Just a quick global equity breadth check here. As a reminder, these breadth models are looking at breadth across countries i.e. the main...
Callum Thomas
Mar 26, 20182 min read


Sentiment Snapshot: Technically Bearish
As a reminder, the weekly survey on Twitter asks respondents their views/positioning on equities and bonds based on whether their view is...
Callum Thomas
Mar 26, 20182 min read


ChartBrief 198 - S&P500 Extremes
For some time we have talked about 2 specific extremes in the S&P500. But as a confluence of 3 key themes have transpired to reveal a...
Callum Thomas
Mar 24, 20182 min read
Weekly Macro Themes - 23 Mar 2018
Here's a brief preview of the topics and charts covered in the latest edition of the Weekly Macro Themes report. To read more and see the...
Topdown Charts
Mar 23, 20182 min read


Global Equity Breadth Breakdown
The latest price action across global equities has driven a deterioration in market breadth. The 50-day moving average breadth indicator...
Callum Thomas
Mar 21, 20182 min read


Chart Of The Week: DM ERP
This week the "Chart of the Week" shows the equity risk premium across a couple of key developed economy stockmarkets. The equity risk...
Callum Thomas
Mar 20, 20182 min read


Sentiment Snapshot: Bonds Bounded
In markets it's important to be mindful of both the tides and the waves, and the latest weekly sentiment survey on Twitter provides some...
Callum Thomas
Mar 19, 20183 min read


Weekly S&P500 #ChartStorm - 18 Mar 2018
Those that follow my personal account on Twitter will be familiar with my weekly S&P 500 #ChartStorm in which I pick out 10 charts on the...
Callum Thomas
Mar 18, 20186 min read


Crypto Charting: 5 More Charts on the Outlook for Bitcoin prices
In response to a couple of client queries, we've slowly built up some indicators for this still very nascent market. As most of our...
Callum Thomas
Mar 17, 20184 min read
Weekly Macro Themes - 16 Mar 2018
Here's a brief preview of the topics and charts covered in the latest edition of the Weekly Macro Themes report. To read more and see the...
Topdown Charts
Mar 16, 20182 min read
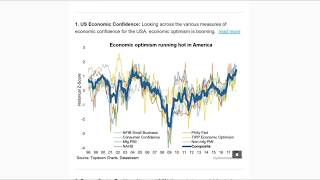
VIDEO: Top 5 Charts of the Week
In this video we run through the weekly email newsletter "The Top 5 Charts of the Week". In this week's edition we look at US economic...
Topdown Charts
Mar 14, 20181 min read


A Familiar if Ominous Sign in the US IPO Market
UPDATE (7 April 2019): The 2018 figure came in at a new record high of 81%, which both highlights an interesting apparent trend, and will...
Callum Thomas
Mar 14, 20182 min read


Chart Of The Week: Energy Stocks
This week the "Chart of the Week" looks at the energy sector of the S&P500 and specifically how it fits in in terms of market...
Callum Thomas
Mar 13, 20182 min read


Sentiment Snapshot: Fundamentally Sound
Price by itself can very quickly change the tone in markets, and we saw a very clear example of that in the latest weekly sentiment...
Callum Thomas
Mar 12, 20183 min read


ChartBrief 195 - OECD Leading Indicators at a Turning Point
The latest round of OECD Composite Leading Indicators was just released, and given how useful these indicators can be in shedding light...
Callum Thomas
Mar 10, 20182 min read
bottom of page